


How to set up Python (and Flask) error tracking

Contents
No matter how hard you try to prevent errors, they inevitably happen. To limit their impact, you need to catch and fix them as quickly as possible. PostHog provides error tracking to help you do this.
In this tutorial, we set up error tracking in both a basic Python script and a slightly more complicated Flask app. In both, we go from writing the code to installing PostHog to capturing errors.
Autocapturing errors in Python
PostHog can automatically capture unhandled exceptions in Python, as long as it’s version 3.9 or newer.
To do this, start by creating a python-error directory with a virtual environment.
Next, activate that virtual environment and install PostHog.
Once done, we can create our script in an error.py file. It initializes PostHog with a project token and host from your project settings, and then intentionally raises an exception. We can use PostHog’s enable_exception_autocapture config option to automatically capture that unhandled exception.
This looks like this:
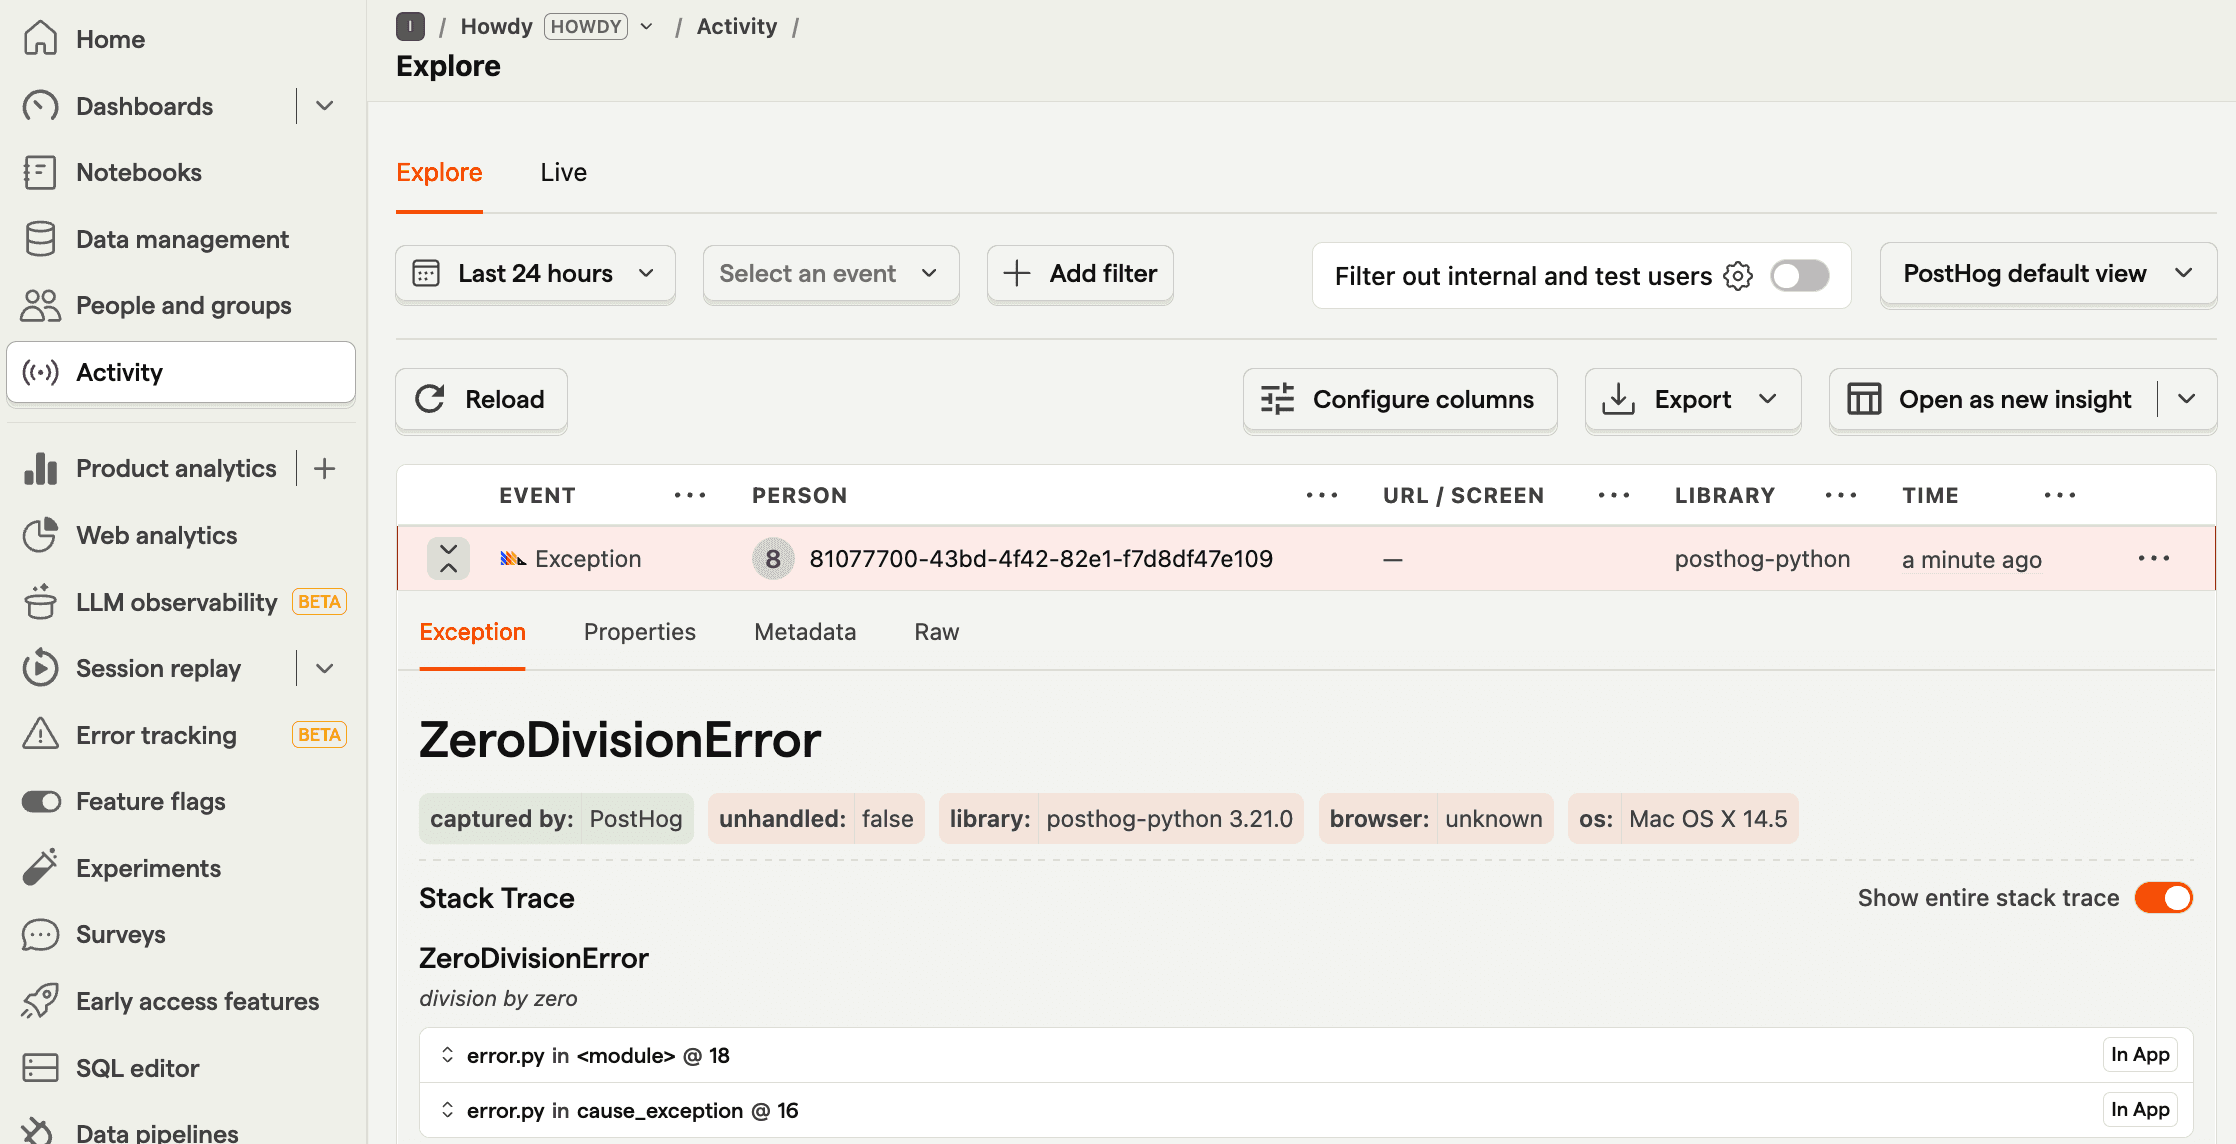
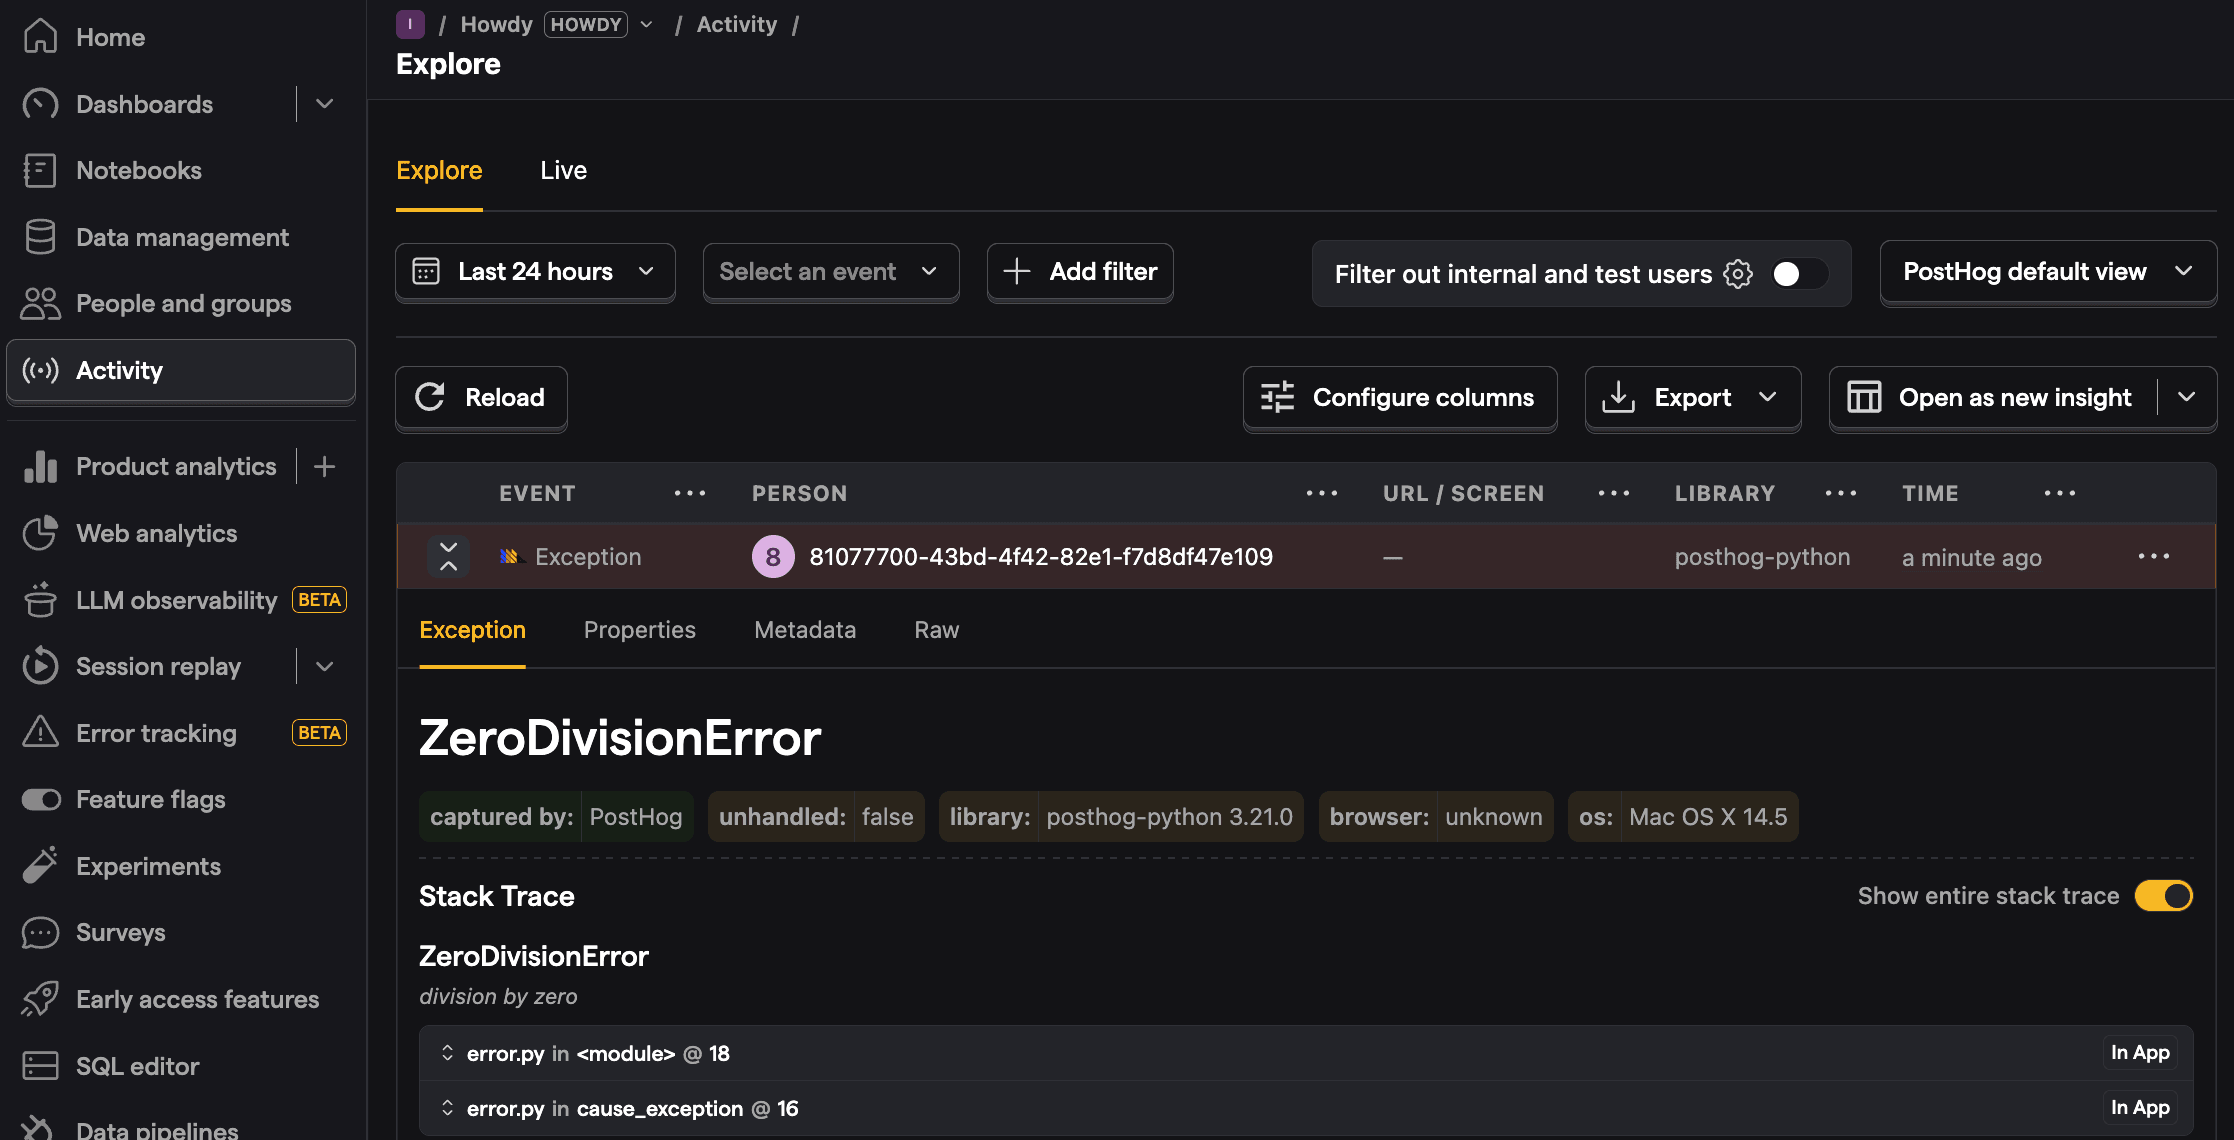
Now, run python error.py. You’ll cause an error that is autocaptured by PostHog.
Capturing errors in Flask
Python frameworks like Flask often have built-in error handlers. This means PostHog’s default error autocapture won’t work. Instead, we need to manually capture errors.
To show this off, we’ll build a basic Flask app. To start, ensure your virtual environment is still active then install Flask:
Next, create an app.py file with the following basic setup:
You can then run python app.py and go to http://localhost:5000/error to see your intentional error (that’s handled by Flask).
Setting up PostHog
Because we already installed PostHog, all we need to do now is initialize it with your project token and host from your project settings, calling capture_exception() like this:
When you go to http://localhost:5000/error now, you’ll see the error captured in PostHog.
Monitoring errors in PostHog
Beyond the basic activity tab view, PostHog has a dedicated error tracking tab to view captured errors grouped into issues along with stack traces, frequency, and more.
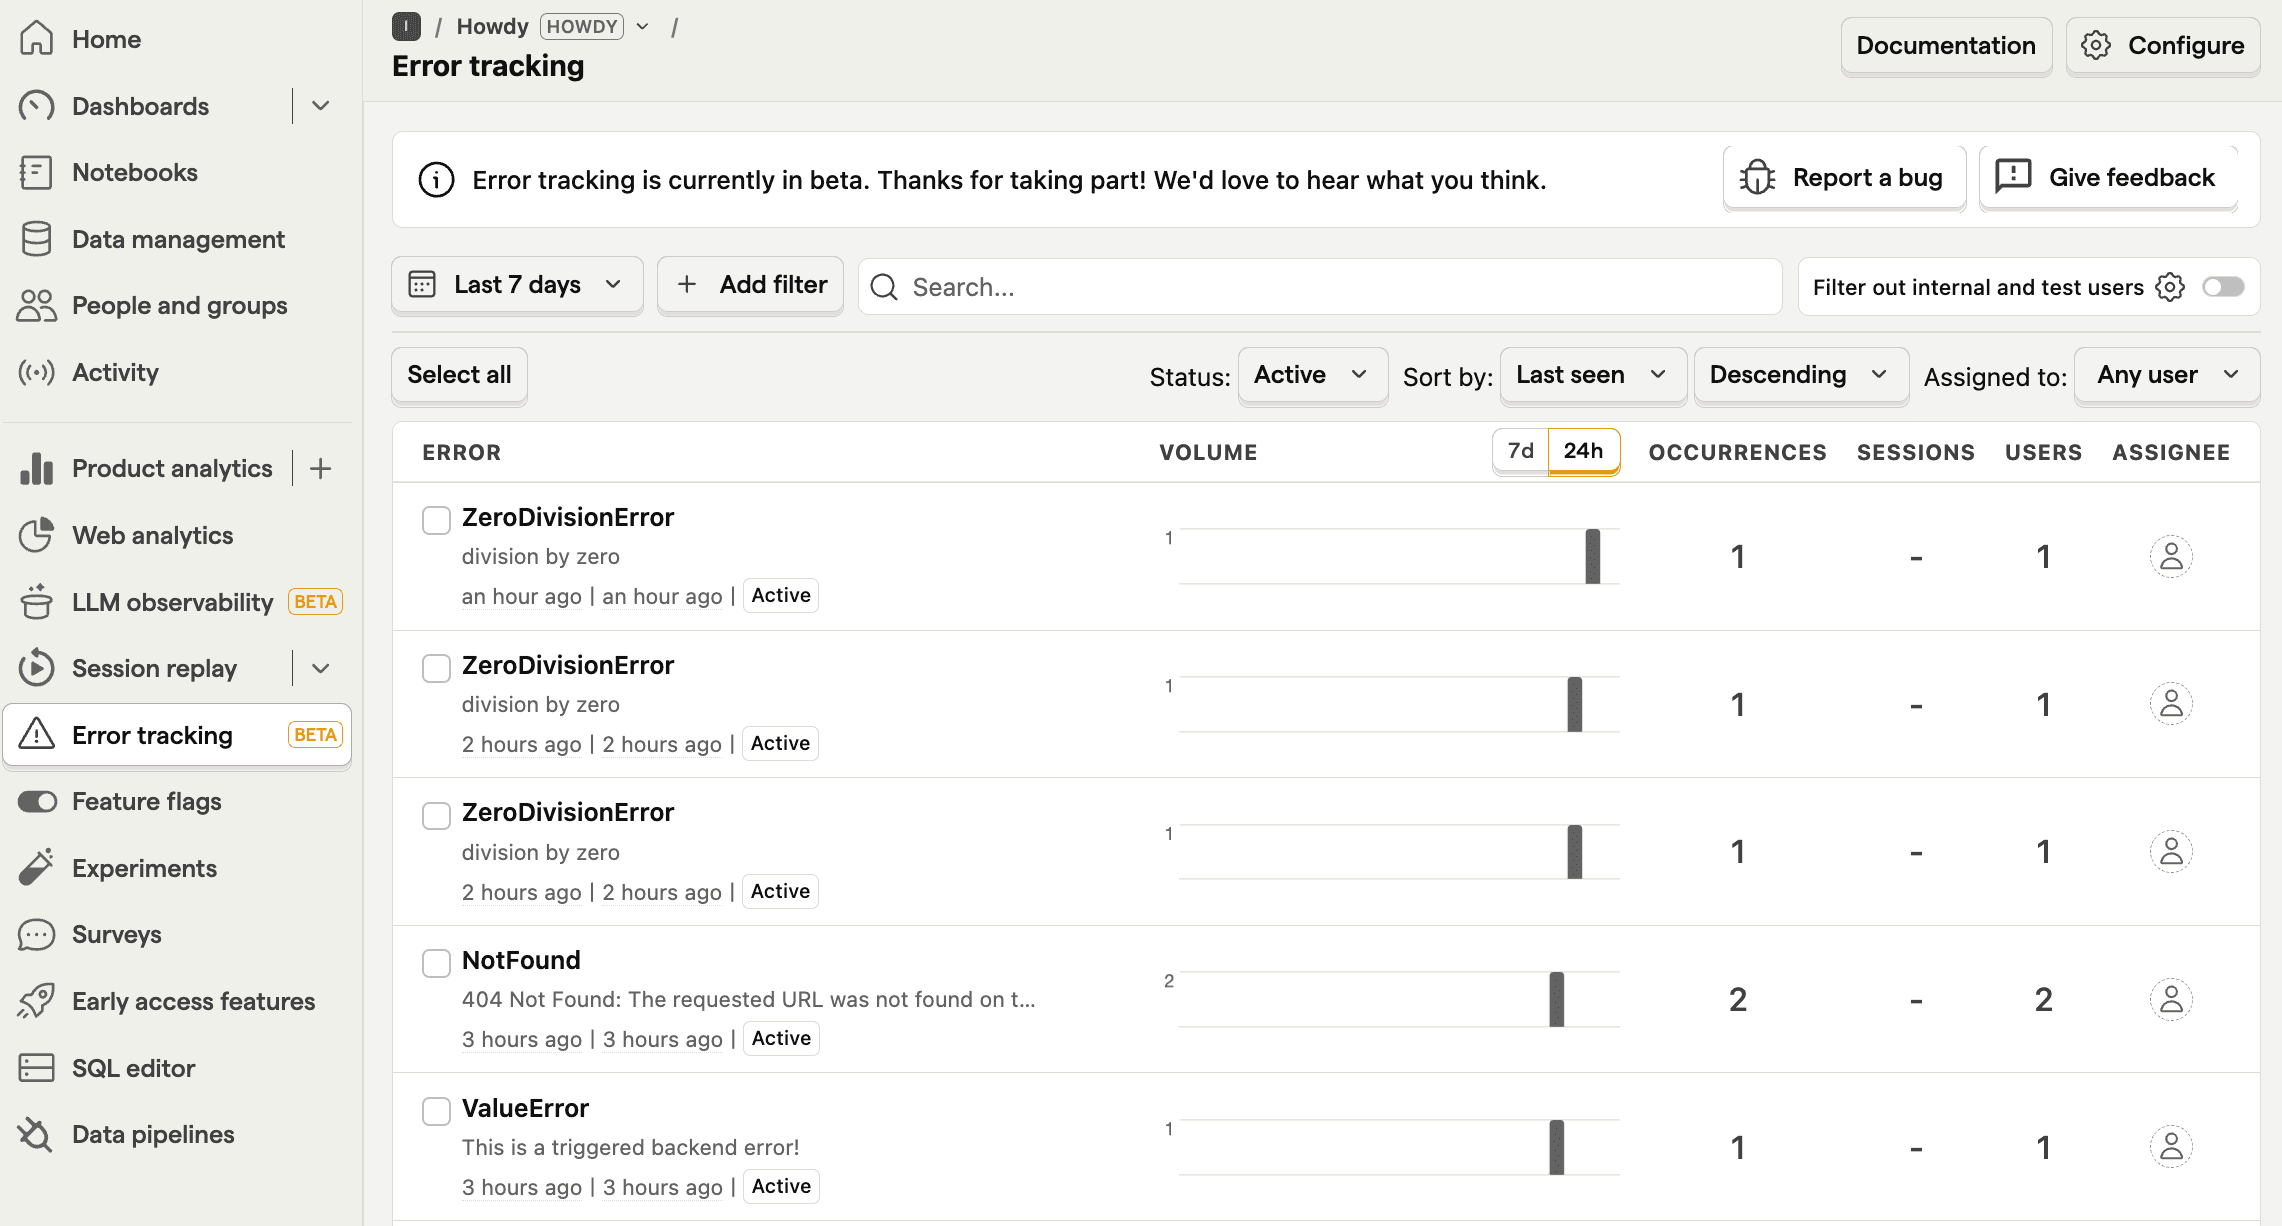
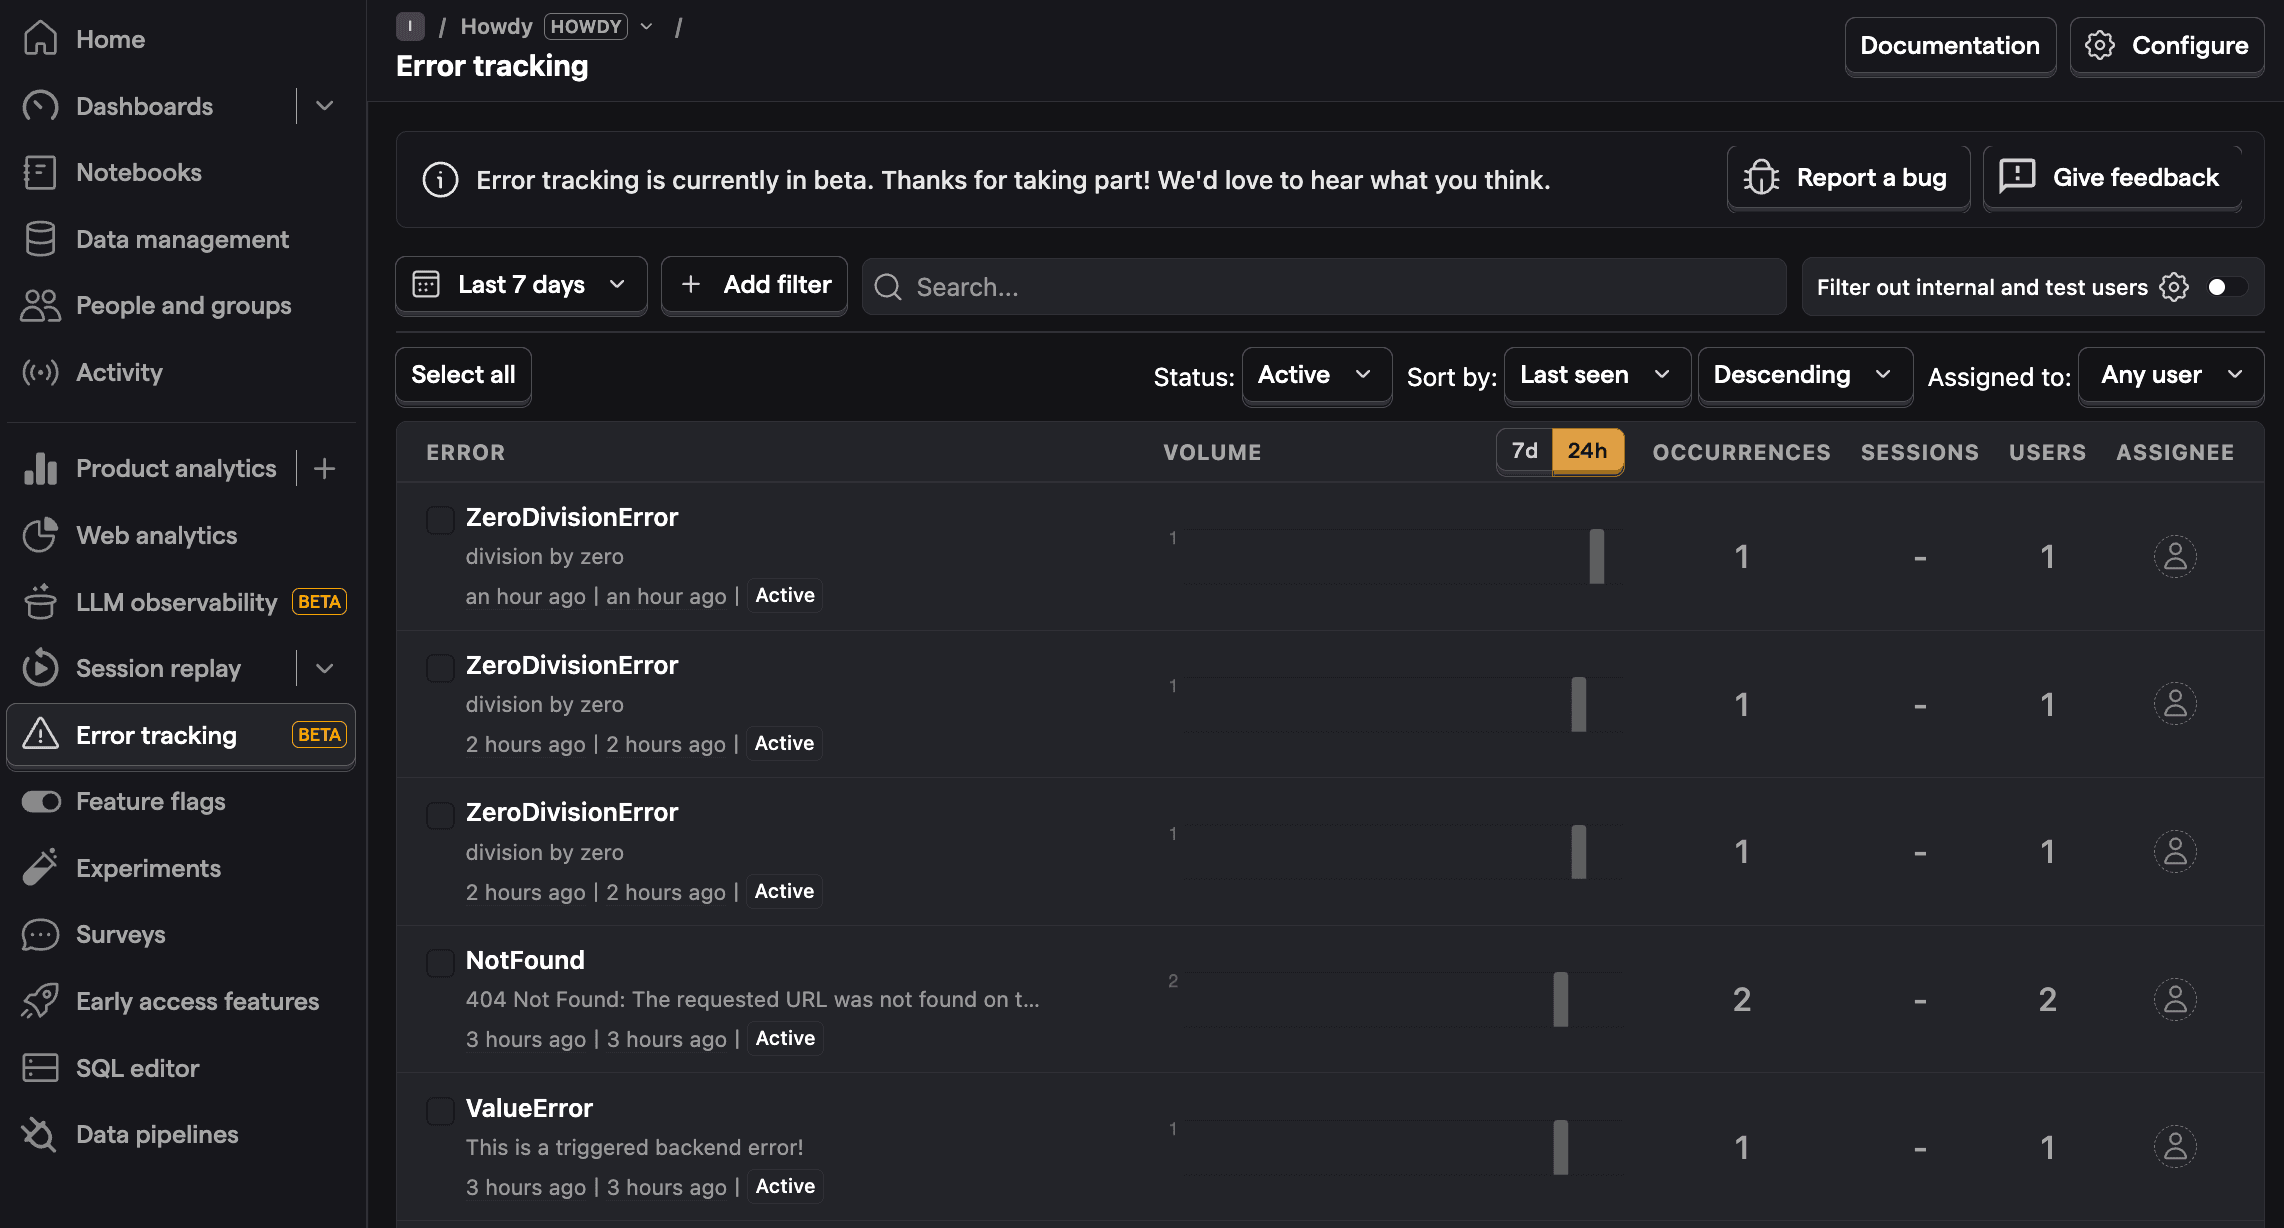
You can click into any of these errors to get more details on them, including a stack trace as well as archive, resolve, or suppress them. On top of this, you can analyze $exception events like you would any event in PostHog, including setting up trends for them and querying them with SQL.
PostHog is the leading platform for building self-driving products. With a full suite of developer tools – AI observability, product analytics, session replay, feature flags, experiments, error tracking, logs, and more – PostHog captures all the context agents need to diagnose problems, uncover opportunities, and ship fixes. A data warehouse and CDP tie it all together, unifying that context into one source agents can read across. You can steer it all from Slack, the web app, the desktop (PostHog Code), or your own editor via the MCP.